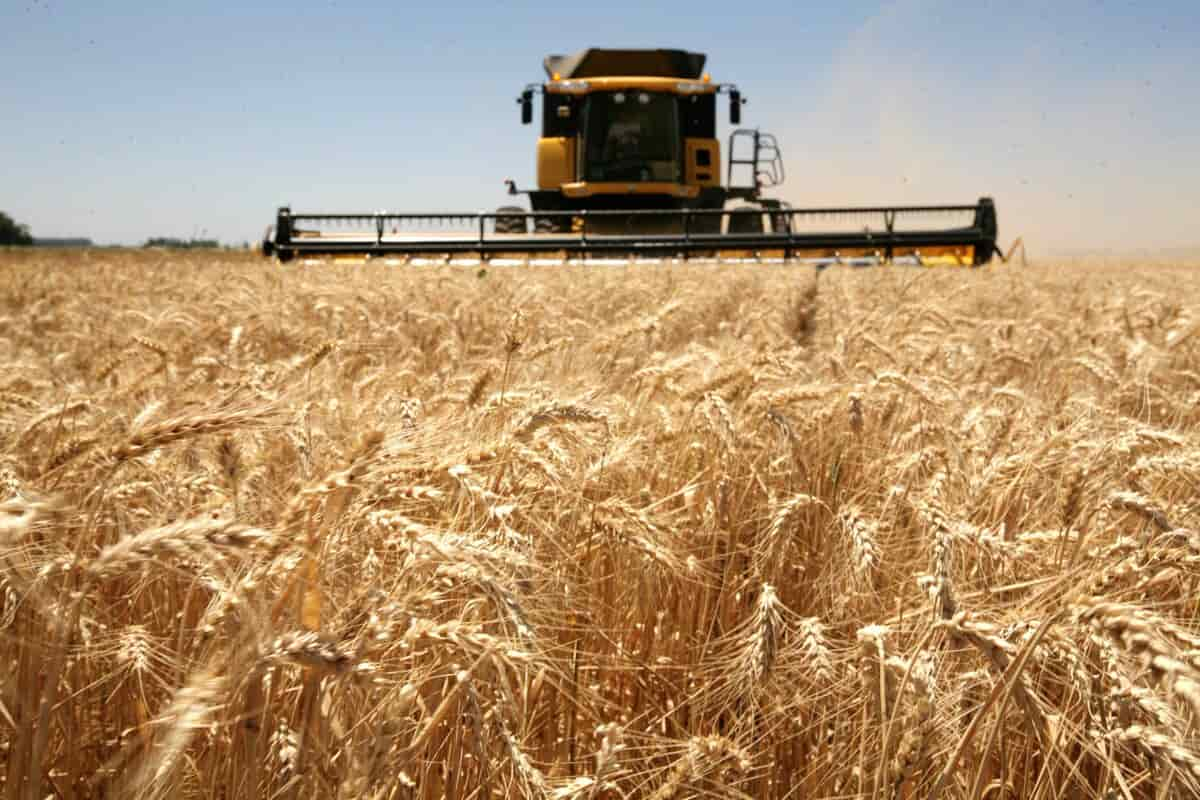
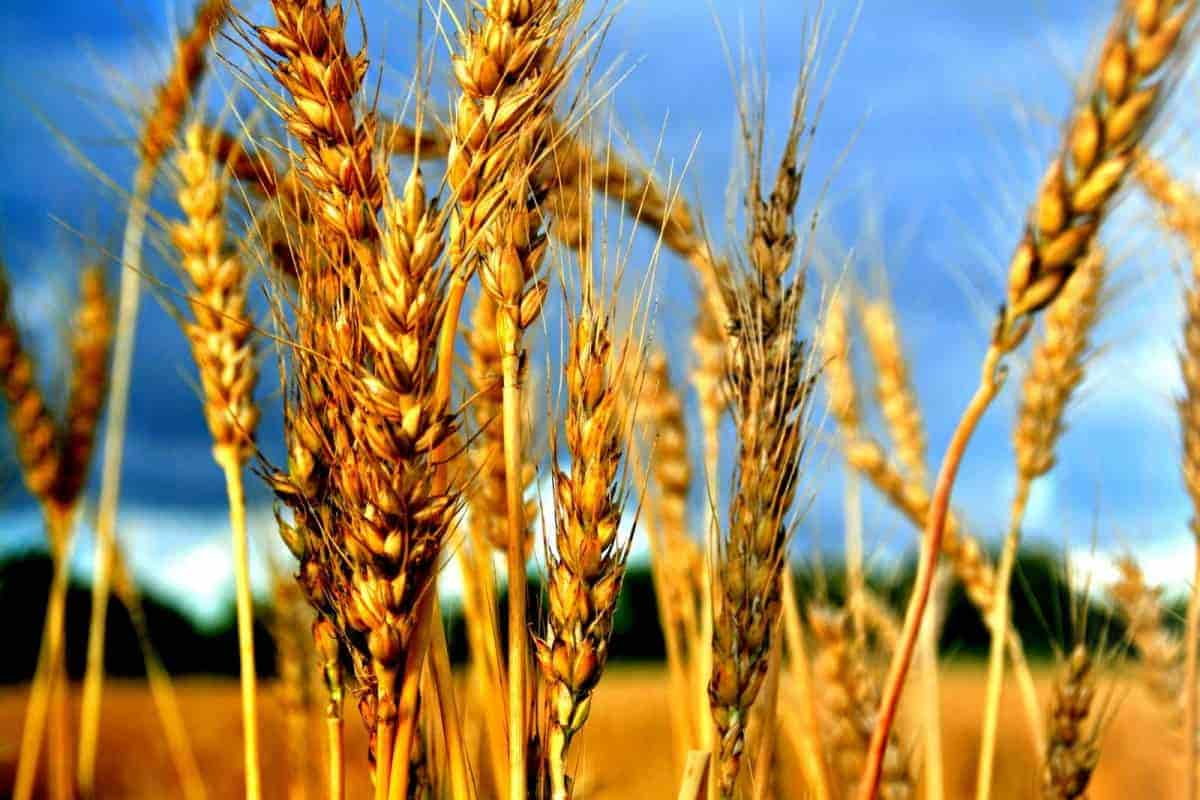
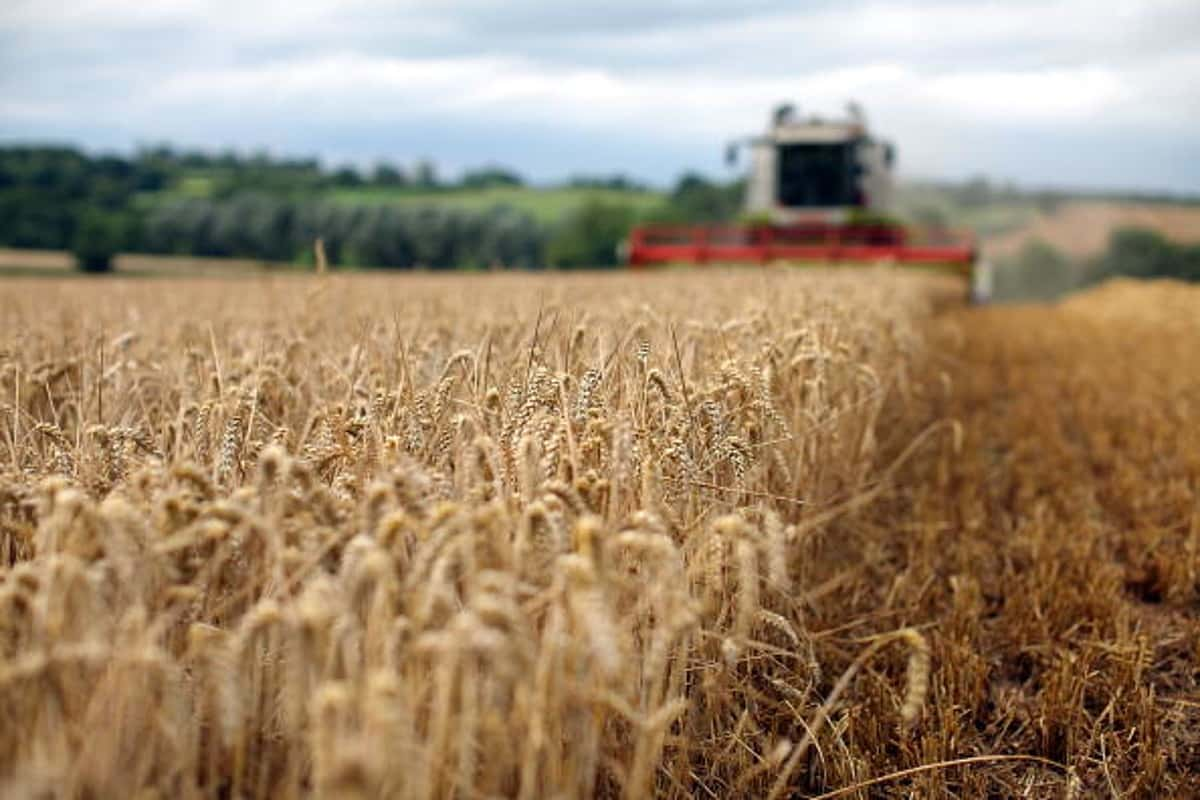
Smart Production of Wheat in the UK
Wheat is the second largest agricultural crop in the world after rice, but production yields vary widely depending on climate and growing conditions
Taking the UK smart market as an example, higher profits are achieved on average compared to the rest of the world
However, there are still significant differences between regions, fields and fields
Smart farming offers excellent capabilities for understanding historical and current dynamics in crop productivity; In this way, growing systems can be optimized to provide economical and sustainable performance
The adoption of technology in the UK has increased as farms have grown in size, reducing costs per hectare
Manufacturers are increasingly supplying devices that support smart farming
Standard technologies such as ISOBUS are critical as they enable greater interoperability between ground equipment and supporting service networks
GPS steering and soil mapping are the most widely used PA technologies in the UK
The main technology for understanding crop productivity is yield mapping; here, hybrid harvesters are equipped with yield tracking devices that, when combined with GPS, create yield locations around the field
It should be emphasized that the yield at this time is the cumulative effect of all the factors (weather) that affected the crop throughout the season
Understanding these factors, especially the processes occurring in soils, is currently difficult and poorly understood
However, this situation is changing, and innovative products are appearing on the market
In this way, the farmer and his advisors can access information and make informed decisions regarding crop management
Despite promising results, the efficiency of these probes is limited by their localization and inflexibility
In the longer term, the use of mobile and possibly collaborative robots, such as those being prototyped by Small Robot Company4 in the UK, offers more flexible and comprehensive capabilities
Livestock: health and wellbeing
Bhargava and Ivanov (2016) present an Edge Mining (EM) method for predicting heat stress in dairy cows
The temperature and humidity index (THI) is calculated using data from a suite of physical sensors in situ
The collar of each cow serves as the starting point for assessment of THI and heat stress
These risks are then communicated to the farmer as necessary
Although this study focuses on dairy cattle, this approach can be applied to a variety of farming systems
The modification of the EM model is described by Bhargava et al
(2017) as well
Here, the movement of a dairy cow is classified on the coil using a classification algorithm developed by the authors called Interactive Edge Mining (IEM)
Two methods, Bare Necessities and Class Act, are used to provide score assignments for the decision tree
This is the signal from the speedometer, from which operating conditions are derived
This information is uploaded to the Cloud; here an animal movement analysis will be carried out before communicating with the farmer
Unloading occurs when the cow is at the milking pad
There was a follow-up study on the effectiveness of the Linear Spanish Inquisition Protocol (L-SIP)
The most recent iteration of the EM study is evaluated as an improved IEM methodology (IEM2
0) augmented with collaborative function-based map matching (CASMM) – an extension of ASMM, providing a perceptual fuzzy analysis solution activities and placement of dairy cows
Preliminary results are promising, up to 99% localization accuracy
Again, the underlying mechanisms are common and applicable
Taneja et al
(2018) also demonstrate the use of edge computing to monitor herd health using a Fog node installed at a farm workstation and footprint sensors mounted on the feet of cows in the herd, one for each cow
The node combines the data, preprocesses, classifies, and selects the models
Such behavior analysis allows you to follow behavioral principles; deviation from these criteria may be, for example, an indicator of disease
Deboch et al
(2018) investigated the potential of CE devices, in this case a smartphone network (iPhone), as Edge animal node behavior
The device was mounted on the halter and five different parameters were measured using the IMU of the device
After processing them, 41 parameters were obtained as a result
When data are considered in terms of frequency and number of sources (cows), data management problems quickly arise; to solve this problem, the lambda-cloud architecture is used
Using Edge Computing on the iPhone reduced the size of raw data transfer by 43
5%
Yukan et al
(2019) describe a low-cost cloud-to-fog hybrid architecture for smart farming
An interesting feature of this architecture is that it contains a complex array of sensors for observing animals and their internal physiological environment; however, the default network is the Raspberry Pi
Using edge computing, the authors demonstrate reduced latency and improved support for scalability, modularity, and reliability
Looking ahead, the application of machine learning is viewed as a feasible approach to reduce sensory components and the basis for more robust noninvasive sensing
Data analysis from sensors takes place at the gateway node (Edge), thus controlling both fans and lights
production of crops
Oliver et al
(2018) described a general monitoring system based on IoT; it has been implemented and tested in a viticulture environment where different climatic parameters and soils are monitored
Strategically, the aim is to anticipate certain diseases in advance, which are associated with vineyards, but in which weather conditions are the best predictors of outbreaks
Examples of such diseases include downy mildew and black rot
The overall architecture is cloud-based and an edge compute node is used to collect data from a network of distributed sensors
The Aqua Farm
In conventional aquaculture, the use of closed aquaculture systems (RAS) offers significant potential to reduce freshwater demand through the use of complex biofiltration systems; however, near real-time control and monitoring is required
Romley et al
(2017) described a fog computing approach for data collection and RAS monitoring using a Raspberry Pi as a fog node
A similar approach has been demonstrated for water control in a growth tank
Later, another method was tested using an ultrasonic sensor to measure water quality